

Appearance
Safety checks
On this page you learn how to see whether your show respects the flight limits, how to find the exact moment and element that breaks them, and how to fix it.
Celestium checks your show at two levels. The first is a fast estimate that runs while you design. The second comes from the bake, which measures the real flight paths.
| Live Safety pre-check | Bake checks | |
|---|---|---|
| Where you see it | Safety button and Safety tab, while you edit | Safety button, Safety tab, Statistics panel and Checks tab, in Bake mode |
| When it runs | By itself, about a second after each edit | When you bake the show |
| What it measures | The motion of your slots (the points drones will fly to) | The path of every real drone, including the flights between formations |
| What it is for | Spotting a tight formation or a fast animation early | The final numbers |
The bake is the authority
The Safety pre-check is an estimate. It does not know which drone goes to which slot, and it does not see the flights between formations. A green Safety button in the editor does not prove a show is safe. Before any flight, read the baked numbers in Bake mode.
The Safety button
The Safety button sits in the top bar and shows the state of the whole design at a glance. In Bake mode it shows the state of the bake instead.
| What you see | Meaning |
|---|---|
| Red, with a number | That many rows are more than 10% past a limit |
| Amber, with a number | That many rows are past a limit, by up to 10% |
| Green, with a check mark | Every row is within its limit |
| A spinner, greyed out | The numbers are being worked out. The button opens again once they are ready |
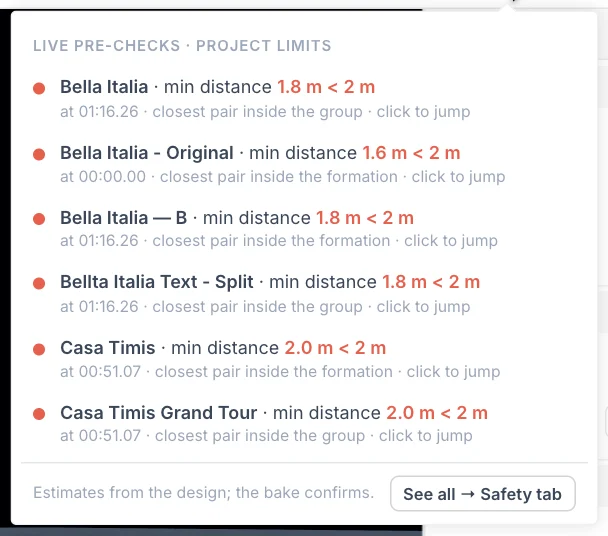
Click the button to open a short list. It shows up to six rows, worst first. If there are no problems, it shows the first six rows instead. The header reads project limits, or no Launch Pad = no limits if your show has no Launch Pad.
Click a row to move the playhead (the marker for the current moment on the timeline) to that moment and select the element. Click See all → Safety tab to open the full list.
The Safety tab
The Safety tab sits next to Timeline in the bottom panel. It shows the same red or amber count as the button, or a spinner while the numbers are being worked out.

Editor estimate or baked show
The strip under the top bar says which one you are looking at.
- Editor estimate. You are in the editor. The numbers come from your slots and do not include the bake, so they may not be accurate. Bake the show, then recheck here in Bake mode.
- Baked show v3. You are in Bake mode, and this is the bake you loaded. Every row is measured on the real drone routes, and every row is about the whole show. Jump also highlights the drones behind the row in the viewport. Pyro rows still count your Ignite clips, because the bake does not measure them.
The bake measures all of this while it runs, so the baked rows appear straight away, whatever the size of the show. A show baked before this feature has to be read first: the strip shows the progress, and baking it again makes it instant.
The bar at the top
- Filters. Choose All, Violations, Distance, Speed, Accel, Altitude or Pyro. Violations shows the amber and red rows, the ones past a limit, and displays their number.
- Limits line. Shows the limits in use, for example
sep ≥ 2 m · H ≤ 5 · up ≤ 3 · down ≤ 2.5 m/s · 3D ≤ 6 m/s · accel ≤ 3 m/s². - Charts. Appears only in Bake mode, and opens the Checks tab.
- Edit limits… Selects the Launch Pad, where the limits live.
- Recheck. Runs the check now. It reads Checking… with a percentage while it works. It is hidden in Bake mode, where the numbers cannot change.
The table
| Column | What it shows |
|---|---|
| Dot | The status of the row: green, amber or red |
| Element | The formation or group, or Whole show |
| Metric | What was measured |
| Value | The worst value found in the whole show |
| Limit | The limit it is compared with, or a dash if there is none |
| When | The moment the worst value happens |
| Detail | A short note, such as closest pair inside the formation |
| Jump | Moves the playhead there and selects the element |
Click a row to chart it on the right. Double-click a row to do the same as Jump. The Whole show row moves the playhead but selects nothing, because it does not belong to one element.
The detail chart
The chart on the right shows the selected row over time. The dashed red line is the limit, and the dot marks the worst moment. The text above the chart compares the two, for example 2.03 m ≥ 2 m, or 1.86 m < 2 m, 7% under when the value is past the limit. An element that never moves shows No time series for a static pose. A speed row of 0.0 m/s with no time means the formation holds still. The drones still fly to it, and the bake measures those flights.
What each metric means
The table lists every metric with the default limits. A value on its limit, or inside it, is green. Amber starts the moment a value is past its limit, and red starts 10% past it. If you change a limit, both move with it.
| Metric | What it measures | Limit | Amber | Red |
|---|---|---|---|---|
| Min distance | The closest two slots get | Min separation, 2 m | Below 2 m, down to 1.8 m | Below 1.8 m |
| Horizontal speed | The fastest slot, moving sideways | 5 m/s | Above 5 m/s, up to 5.5 m/s | Above 5.5 m/s |
| Up speed | The fastest climb | 3 m/s | Above 3 m/s, up to 3.3 m/s | Above 3.3 m/s |
| Down speed | The fastest descent | 2.5 m/s | Above 2.5 m/s, up to 2.75 m/s | Above 2.75 m/s |
| Speed (3D) | The fastest slot in any direction | 6 m/s | Above 6 m/s, up to 6.6 m/s | Above 6.6 m/s |
| Acceleration | The hardest change of speed | 3 m/s² | Above 3 m/s², up to 3.3 m/s² | Above 3.3 m/s² |
| Altitude | The highest slot above the origin | None | Never | Never |
Not every element gets every metric:
- A formation element, such as a shape or text, gets up to seven rows.
- A Formation Group gets Min distance only.
- The Whole show row gets Min distance only. It measures the closest pair across the formations drones are on at the same moment.
What the colours mean
| Dot | Status | Meaning |
|---|---|---|
| Green | ok | The value is within its limit, or exactly on it. |
| Amber | warn | The value is past its limit by up to 10%. Fix it before you fly. |
| Red | bad | The value is more than 10% past its limit. Fix it. |
There is no "close to the limit" colour. The bake flies right up to your limits on purpose, so a value just inside one is the show doing what you asked.
The sampling step is between 0.25 and 1 second, depending on the length of the show. A very short spike can fall between two samples, which is one more reason to read the baked numbers.
What the Whole show row sees
A formation counts from the start of its Track or Takeoff clip until the pad's next Track, Takeoff or Return starts, so a hold after the clip counts too. Formations you fly one after another never count together, because a pad's drones are only on one at a time. Two pads on formations that overlap at the same moment do count, and that turns the row red. The flights between formations are not in this row: the bake measures those. A show with no Track clips has no Whole show row, because nothing flies.
Baked numbers: the Checks tab
The Checks tab appears in the bottom panel while you are in Bake mode. It draws one chart per metric across the whole show, measured on the real drone paths. If it says No baked show to analyse., load a bake first.
| Chart | Unit | Dashed line |
|---|---|---|
| Min Distance | m | Min separation |
| Max Speed (3D) | m/s | Max 3D speed |
| Horizontal Speed | m/s | Horizontal speed |
| Vertical Speed (up / down) | m/s | Up speed and Down speed |
| Acceleration | m/s² | Acceleration |
| Altitude | m | None |
To read a chart:
- Scroll to the chart you want.
- Compare the curve with the dashed line. Min Distance must stay above its line. All the others must stay below theirs.
- Click the chart at the moment you want to see. The playhead moves there, and the white vertical line follows it.
For the worst value of each metric, and to see which drones caused it, use the Statistics panel.
Limit lines use the bake's values
The dashed lines show the limits the bake flew under, and step where a clip overrides them. If you changed a limit since, bake again before you compare. A bake made before this feature shows today's limits instead.
Min Distance counts every drone at all times, including while they sit on the launch grid. If the chart is low at the very start and end of the show, check the Spacing value of the Launch Pad.
How to fix each kind of violation
Min distance inside a formation
The slots of one element are too close together.
- Double-click the row to select the element.
- Make the element bigger, or lower its number of slots.
- Check the row again a moment later.
Min distance inside a group
Two members of a Formation Group overlap or sit too close. Move them apart, or scale the whole group up. The group's Min slot distance in the Properties panel updates as you work.
Min distance on the Whole show row
Two formations on different Launch Pads are in flight at the same moment and sit too close. Press Jump and look at what is close, then move one of them or change when the pads fly.
Speed: horizontal, up, down or 3D
A slot moves too fast. This comes from your own animation, such as keyframes or motion effects.
- Give the move more time by spreading its keyframes apart.
- Make the move smaller.
- Remember that a rotating formation moves fastest at its outer edge. A slower spin or a smaller shape both help.
Acceleration
A slot changes speed too abruptly. Make the same move slower or smaller, or give it more time to start and stop.
Altitude
Altitude has no limit in the app, so the row is always green. It tells you the highest slot above the origin, not above the ground. Compare it yourself with what your flight permission allows. If it is too high, lower the formation.
No limits at all
If the limits line says there is no Launch Pad, every row stays green because nothing is compared. Add a Launch Pad to get real checks.
Only the baked numbers are over the limit
The formations are fine, but the flights between them are not.
- Lengthen the Track clip so the drones have more time to fly. See how long a move takes.
- Check for an Algorithm Bypass clip at that moment. It switches off the limits you tick, so high numbers there are expected.
- Use Override Constraints on a clip to change limits from that clip until the next one. See Flight limits and separation.
Do not raise a limit to clear a warning
Limits describe what your drones can safely do. Raise one only when you know your drones and your site allow it.
Tips
- Work with the Safety button in view. A new red number right after an edit tells you which change caused it.
- If you have more than one Launch Pad, Safety and the Checks lines use the limits of the first one.
- The Safety tab stays available in Bake mode, but it still shows design estimates. Use Charts to reach the baked numbers.
Next
Bake your show, then read the final numbers.